Introduction to Meta-Analysis
CMOR Lunch’n’Learn
6 July 2023
Ross Wilson
2. Calculate weighted effect
- Generally, meta-analyses use an inverse-variance weighted method
\[\text{Weighted average} = \frac{\sum{Y_i W_i}}{\sum{W_i}}\]
where \(W_i = (1 / SE_i)^2\)
- For ratio measures, both the effects and standard errors are on the log scale
- These can be transformed back to the original scale for reporting
- There are slight variants to this general approach for some methods (particularly for dichotomous outcomes)
3. Calculate standard errors
- In the general inverse-variance method, the standard error of the weighted summary statistic is
\[\text{Standard error} = \frac{1}{\sqrt{\sum{W_i}}}\]
- Again, different formulae for some specific methods
4. Estimate heterogeneity
Heterogeneity is measured by
\(Q = \sum{W_i (Y_i - \overline{Y})^2}\)
and
\(I^2 = \text{max}\left\{\frac{Q - (k - 1)}{Q}, 0\right\}\)
Q is a test statistic following a chi-squared distribution, and I2 is interpreted as the proportion of total variance in study estimates due to heterogeneity rather than sampling error
- NOTE: I2 can be very uncertain (imprecise) when the number of studies is small
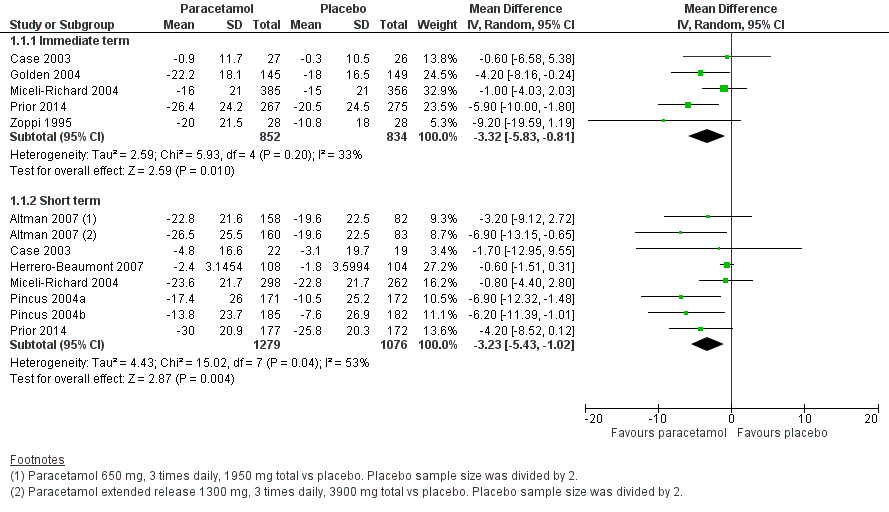
5. Summarise findings graphically
Meta-analyses are usually illustrated using a forest plot
A forest plot displays effect estimates for both individual studies and the overall meta-analysis result
Each study is represented by a square (usually) at the point estimate, and horizontal lines extending to bounds of the confidence interval
- The size of the block indicates the weight assigned to that study in the meta-analysis (roughly proportional to sample size)
The summary result is presented as a diamond at the bottom, centred on the meta-analysis point estimate and with width showing the confidence interval
![]()
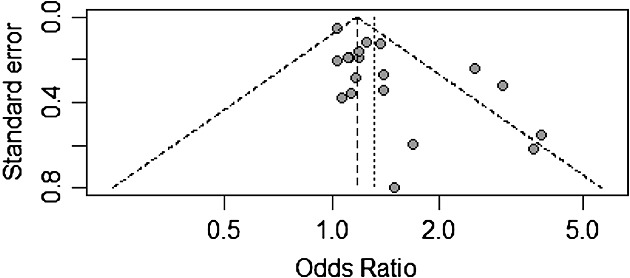
Assessing small-study bias and publication bias
- Small sample bias: small studies may show larger intervention effects than larger studies
- Non-reporting/non-publication bias
- Poor methodological quality
- Mechanistic vs. pragmatic designs
- A ‘funnel plot’ can help detect this
![]()
Software
- Cochrane RevMan
- Manages all stages of the systematic review process, from design to data extraction, analysis, and visualiation
- Free for those doing Cochrane reviews, subscription for everyone else
- R: there are several packages for meta-analysis
- See the Meta-Analysis Task View:
https://cran.r-project.org/view=MetaAnalysis
metafor is a comprehensive package with functions for converting published results to common summary statistics, fitting inverse-variance weighted and related models, forest and funnel plots, heterogeneity measures, and diagnostic statistics (among others)